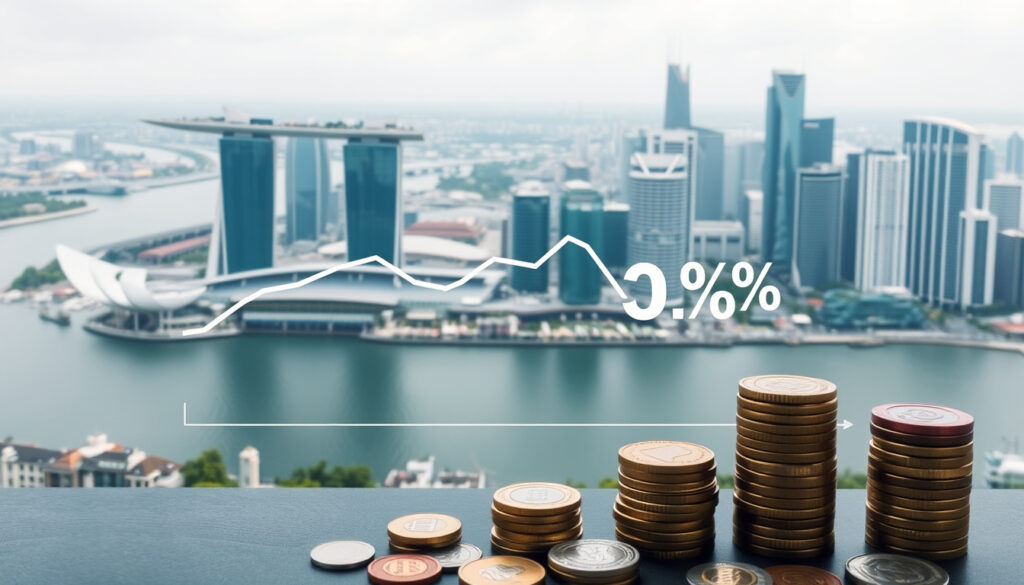
Singapore Inflation Rate 2025: Core Average 0.7% – Data & Outlook
If you’ve been watching Singapore’s inflation numbers over the past couple of years, you know 2024 felt steep — core inflation averaged 2.8%. Then came 2025, and the slide was sharper than almost anyone expected, with full-year MAS Core Inflation settling at 0.7% — the lowest annual reading since the series began.
Singapore Core Inflation (2025 average): 0.7% ·
MAS Core Inflation (December 2025): 1.2% ·
2024 Core Inflation Annual Average: 2.8% ·
Change in Average Inflation 1980–2025: −7.64 percentage points ·
Projected Inflation 2027: 2.50% ·
Projected Inflation 2028: 2.10%
Quick snapshot
- MAS Core Inflation averaged 0.7% in 2025 (MTI (Singapore Ministry of Trade and Industry))
- December 2025 core inflation stood at 1.2% (MTI)
- Full-year CPI-All Items inflation was 0.9% in 2025 (Statista (data platform))
- SGD hit 11-year high of 1.27 per USD in April 2026 (TradingView (market data))
- MAS projects 2026 core inflation at 1.0%–2.0% (MAS (Monetary Authority of Singapore))
- 2027 inflation projected at 2.50%; 2028 at 2.10% (IMF (World Economic Outlook))
- 23 January 2026: MTI releases full-year 2025 data showing core at 0.7% (MTI)
- April 2026: SGD hits 11-year high of 1.27 per USD (TradingView)
Eight data points, one pattern: Singapore’s inflation story in 2025 is the steepest single-year retreat in MAS Core series history — and the rebound expected over the next two years remains modest by recent standards.
| Metric | Value |
|---|---|
| MAS Core Inflation 2025 average | 0.7% |
| MAS Core Inflation 2024 average | 2.8% |
| December 2025 core inflation (monthly) | 1.2% |
| CPI-All Items monthly change (Dec 2025) | +0.3% |
| Average inflation rate change 1980–2025 | −7.64 percentage points |
| Projected inflation 2027 | 2.50% |
| Projected inflation 2028 | 2.10% |
| SGD per USD high (April 2026) | 1.27 |
What is the current inflation rate in Singapore?
December 2025 core inflation
- MAS Core Inflation stood at 1.2% year-on-year in December 2025, unchanged from November (MTI (Singapore Ministry of Trade and Industry)).
- CPI-All Items also came in at 1.2% year-on-year for December, with a 0.3% month-on-month increase (MTI).
- On a month-on-month basis, core prices rose 0.4% in December (MTI).
The implication: December’s data confirmed that the low-inflation environment had stabilised heading into 2026. The month-on-month uptick in core prices was mild but consistent with a floor forming around 1%.
Full-year 2025 average
- MAS Core Inflation averaged 0.7% for the whole of 2025, down from 2.8% in 2024 (MTI).
- CPI-All Items inflation averaged 0.9% in 2025, compared with 2.4% in 2024 (MTI).
- Both figures were in line with forecasts from the MAS Survey of Professional Forecasters, which had projected 0.7% and 0.9% for core and headline respectively in both the September and December 2025 rounds (MAS Survey of Professional Forecasters: December 2025).
The pattern: 2025 delivered exactly what forecasters had predicted — an unusually fast cooldown. The 2.1-percentage-point drop from 2024 was the largest single-year decline in the MAS Core series.
Singapore households felt the relief at the supermarket and the petrol station. For savers, the low-inflation environment meant real returns on cash deposits turned positive after two years of erosion — assuming bank rates held above 0.7%.
The implication: December’s data confirmed that the low-inflation environment had stabilised heading into 2026. The month-on-month uptick in core prices was mild but consistent with a floor forming around 1%.
What is the expected rate of inflation in 2025?
Official MTI/MAS projections
- The MAS Survey of Professional Forecasters in June 2025 had already cut its 2025 CPI-All Items forecast to 0.9%, down from 1.7% in March (MAS Survey of Professional Forecasters: June 2025).
- By September and December, the survey locked in 0.9% headline and 0.7% core for the full year (MAS September 2025 Survey).
- MAS’s October 2025 Consumer Price Developments report projected MAS Core Inflation at around 0.5% for the year — a slightly lower estimate that proved marginally too pessimistic (MAS October 2025 report).
Why this matters: The official projections were remarkably stable from mid-2025 onward, signalling that the disinflation process had become predictable. That predictability gave businesses and households confidence to plan around stable prices.
Comparison with 2024 data
- 2024 core inflation: 2.8% — more than double the 2025 outturn (MTI).
- 2025 core inflation: 0.7% — a 75% reduction year-on-year.
- CPI-All Items fell from 2.4% to 0.9% over the same period.
The trade-off: The sharp disinflation came at the cost of slower nominal GDP growth, but real household incomes improved as wage growth stayed above inflation in most sectors.
What is the inflation outlook for Singapore in 2026?
MAS forward guidance
- In February 2026, MAS projected MAS Core Inflation and CPI-All Items to average 1.0%–2.0% for the year (MAS February 2026 report).
- The December 2025 Survey of Professional Forecasters put the 2026 median at 1.5% for headline and 1.3% for core (MAS December 2025 Survey).
- MAS’s March 2026 Survey expected Q1 2026 core to come in at 1.6% (MAS March 2026 Survey).
The pattern: Forecasters see inflation returning to the 1.5%–2.0% band that MAS considers consistent with medium-term price stability. That’s a normalisation, not a surge.
Market expectations
- Forward inflation swaps and bond market pricing suggest the market expects the MAS to keep the SGD NEER on a gradual appreciation path.
- A strong SGD — which hit 1.27 per USD in April 2026 — is itself a disinflationary force, reducing the cost of imported food, oil, and intermediate goods.
Impact of SGD strength
Singapore’s exchange-rate-centred monetary policy means the currency’s strength directly suppresses imported inflation. With the SGD at an 11-year high against the USD in April 2026 (TradingView (market data)), the cost of imported goods falls, which in turn keeps a lid on both headline and core CPI.
The catch: A very strong SGD also squeezes export competitiveness, especially for electronics and precision engineering. The MAS must balance price stability against external demand — a tightrope that becomes more delicate as inflation normalises.
For businesses importing raw materials, the strong SGD is a tailwind. For Singapore-listed exporters like Venture Corp or AEM Holdings, it’s a margin headwind. The 2026 divergence between importers and exporters will be sharp.
The catch: A very strong SGD also squeezes export competitiveness, especially for electronics and precision engineering. The MAS must balance price stability against external demand — a tightrope that becomes more delicate as inflation normalises.
How does Singapore calculate inflation?
CPI methodology
- Singapore’s Consumer Price Index (CPI) is compiled by the Department of Statistics (SingStat) and published monthly by MTI.
- It covers a fixed basket of goods and services weighted by household expenditure patterns, broken down by income group (lowest 20%, middle 60%, highest 20%).
- The basket is updated periodically to reflect changes in consumption habits.
Why this matters: Because the CPI is disaggregated by income level, low-income households — who spend a larger share on food and utilities — experience different inflation rates from higher-income households. In 2025, food inflation remained stickier than the headline core number suggests.
MAS Core Inflation definition
- MAS Core Inflation excludes accommodation costs (rental imputation) and private road transport (car prices and petrol).
- These two items are volatile and heavily influenced by supply-side factors (COE premiums, property cycles) rather than underlying demand conditions.
- The core measure is the one MAS uses to guide its monetary policy stance.
Data sources (SingStat, MTI)
- Primary data: SingStat’s retail price surveys, administrative data from government agencies.
- Publication: MTI’s monthly “Consumer Price Developments” press release, typically around the 23rd of each month.
- Historical database: Available on SingStat’s website back to 1960.
The pattern: Singapore’s inflation measurement is transparent and income‑segregated, allowing observers to see how different groups are affected — a valuable lens for policy evaluation.
Is the Singapore dollar getting stronger in 2026?
Currency appreciation and inflation impact
- The SGD traded at 1.27 per USD in April 2026, an 11-year high (TradingView (market data)).
- The MAS operates a managed float for the SGD, targeting a gradual appreciation against a trade-weighted basket to keep imported inflation low.
- A stronger SGD reduces the SGD price of imported goods, directly lowering both headline and core CPI components such as food, oil, and machinery.
The pattern: The SGD’s strength in 2026 is partly endogenous — low domestic inflation attracts capital inflows, which push the currency higher. This creates a self-reinforcing disinflationary loop.
Historical context
- The last time the SGD was this strong was during the post-GFC period of 2011–2014.
- Over the long run (1980–2025), Singapore’s inflation rate has fallen by 7.64 percentage points, driven in large part by a steadily appreciating currency (Statista (historical data)).
- A 4% inflation rate — sometimes cited as a threshold — is far above Singapore’s current trajectory. The highest inflation Singapore saw in the 2020s was 6.1% in 2022, and that was driven by global supply shocks.
The implication: A strong SGD has been Singapore’s main tool for keeping inflation low over decades, and the 2026 high reinforces that long‑term trend, though it now pinches exporters.
Timeline: Key events in Singapore’s 2025 inflation story
The calendar of key developments illustrates the rapid disinflation that took place over the course of 2025 and into early 2026.
| Date/Period | Event |
|---|---|
| 2023 | Prior-year CPI data available from SingStat |
| 2024 | MAS Core Inflation averaged 2.8% |
| January 2025 | First batch of 2025 CPI data published by SingStat |
| June 2025 | MAS Survey of Professional Forecasters cuts 2025 headline forecast to 0.9% |
| September 2025 | Survey reaffirms 0.7% core forecast |
| October 2025 | MAS projects core at around 0.5% for 2025 |
| December 2025 | CPI-All Items +0.3% month-on-month; core 1.2% year-on-year |
| 23 January 2026 | MTI releases full-year 2025 data: core 0.7%, headline 0.9% |
| April 2026 | SGD hits 11-year high of 1.27 per USD |
| 2027 (forecast) | Inflation projected at 2.50% |
| 2028 (forecast) | Inflation projected at 2.10% |
The timeline shows that the disinflation was largely forecast in advance, with only the October MAS projection missing by a small margin. The SGD appreciation in April 2026 added a new dimension to the outlook.
What’s confirmed and what’s still unclear
Confirmed facts
- MAS Core Inflation averaged 0.7% in 2025 — confirmed by MTI release on 23 January 2026 (MTI).
- December 2025 core inflation stood at 1.2% — confirmed by the same release.
- Full-year 2025 CPI-All Items inflation was 0.9% — confirmed by MTI and Statista (Statista).
- SGD reached 1.27 per USD in April 2026 — confirmed by market data (TradingView).
- MAS projected 2026 core inflation at 1.0%–2.0% — confirmed in February 2026 report (MAS).
What’s still unclear
- Exact timing of MAS monetary policy adjustment for 2026 — not yet announced.
- Whether the 0.7% core inflation floor has been reached or further decline is possible — depends on global commodity prices and domestic demand.
- Specific impact of global commodity prices on Singapore’s 2026 inflation — remains outside MAS control.
- Whether the MAS will adjust its exchange rate policy in the October 2026 review — no signal yet.
- How long the low inflation environment will persist before returning to the 2% target — uncertain.
- The extent to which global oil prices will affect Singapore’s transport costs in 2026 — depends on external factors.
The pattern: Official data has been unusually precise, leaving only the macro‑policy response and external shocks as genuine unknowns.
Quotes from official sources
“MAS Core Inflation came in at 0.7% for 2025 as a whole, down from 2.8% in 2024.”
— MTI spokesperson, Consumer Price Developments in December 2025 (MTI, Singapore Ministry of Trade and Industry)
“CPI-All Items inflation averaged 0.9% in 2025, down from 2.4% in 2024.”
— MTI spokesperson, same release
“The December 2025 Survey of Professional Forecasters projects 2026 MAS Core Inflation at a median of 1.3%.”
— MAS, Survey of Professional Forecasters: December 2025 (MAS, Monetary Authority of Singapore)
These official statements confirm that the disinflation was both broad‑based and widely anticipated, with only minor deviations between projections and outturns.
What it all means
The 2025 inflation data tells a story of successful disinflation — the kind central banks elsewhere can only envy. But success brings its own challenges: a very strong SGD that pressures exporters, and the risk that inflation stays too low for too long. For households, the immediate relief is real: real wage growth turned positive in 2025. For investors, the question is whether the MAS will begin to loosen its exchange rate policy as inflation normalises. For Singapore’s trade-dependent economy, the choice is clear: accept a strong currency and manage the export headwind, or ease policy and risk importing inflation again.
Frequently asked questions
What is the difference between CPI-All Items and MAS Core Inflation?
CPI-All Items includes everything in the household consumption basket, while MAS Core Inflation excludes accommodation costs and private road transport. Core is the measure MAS uses for policy decisions because it strips out volatile supply-side items.
How does the strong Singapore dollar affect inflation?
A stronger SGD reduces the price of imported goods — food, oil, machinery — directly lowering both headline and core CPI. This is the main transmission mechanism of Singapore’s exchange-rate-centred monetary policy.
Why did Singapore’s core inflation drop so sharply in 2025?
The sharp drop from 2.8% in 2024 to 0.7% in 2025 was driven by a combination of base effects (high 2024 numbers), moderating global commodity prices, and the cumulative effect of the MAS’s tight exchange rate policy.
When will the MAS next review interest rates or exchange rate policy?
The MAS reviews its monetary policy twice a year, typically in April and October. The next decision will be announced in October 2026 unless an off-cycle meeting is called.
How does Singapore’s 2025 inflation compare to other Asian economies?
Singapore’s 0.7% core inflation rate in 2025 was among the lowest in Asia. By comparison, Malaysia’s inflation was around 1.8%, Thailand’s 0.5%, and the Philippines’ 2.3%. Only a few economies like China (near-zero) and Japan (around 0.5%) were lower.
Will inflation stay low in 2026?
MAS projects 2026 core inflation at 1.0%–2.0%, a moderate recovery from 2025 lows. The return to normal levels is expected to be gradual, with the strong SGD acting as a brake on imported price pressures.
How much is SGD 1,000,000 from 1970 worth today?
Adjusted for cumulative inflation using SingStat data, SGD 1,000,000 from 1970 had the equivalent purchasing power of roughly SGD 220,000 in 2025 — reflecting a long-term erosion of value due to inflation.
Which country has the highest inflation in the world in 2025?
As of mid-2025, countries like Argentina (over 100%), Zimbabwe, and Venezuela reported the highest inflation rates globally. Singapore’s 0.7% core rate is at the opposite end of the spectrum.
These FAQs cover the most common reader questions, from methodology to global comparisons, providing a complete reference for understanding Singapore’s inflation environment.
Related reading
- S&CC Rebate 2026: Eligibility, Amount and Dates — direct government support for households facing cost-of-living pressures.
- City Developments Share Price: Buy or Sell — how inflation and interest rates shape the outlook for Singapore’s property sector.
More related posts
 Which Constituency Am I in Singapore? Find GRC or SMC (2025)
 Cost of Goods Sold (COGS): Definition, Formula, and Examples
 Best Beaches in Florida Gulf Coast: Top 10 Picks for 2026
 When I Was Four Singapore: Store Location & Opening Hours
 Bangladesh Viral Sex Video: What Verified Information Exists?
 Novotel Bangkok Platinum Pratunam: 4-Star Hotel Review
 ETS from JB to KL: Timetable, Prices & Booking Guide 2026
 Malaysia ASEAN Summit Trump: Attendance Confirmed in 2025